

A sales number has a long commute. It starts at a register on a Tuesday afternoon, rides the nightly feed into a data warehouse, gets averaged into a weekly roll-up, lands on a dashboard as a red cell, and finally arrives, weeks later, on a slide that reads “Espresso machine underperforming in the Southeast. Recommend markdown.”
Every stop on that route was accurate. Nobody fudged a number. And yet in a third of the doors behind that red cell, the espresso machine spent the promotional window in a backstock cage, visible to no one but the field rep who eventually found it. The data said demand was soft. The store said availability was. Those two diagnoses lead to very different decisions, and only one of them is right.
This is the missing link between retail execution and business performance. Sales data tells brands what happened. It is far less reliable about why. The context that answers the second question rarely lives in a system. It lives in the store, and brands that capture it work with a complete picture while everyone else interprets results one layer removed from reality.
Performance data tells you what happened, and rarely why
Traditional performance metrics do their job well. They show that sales rose or fell, that sell-through performance shifted, that one region beat another, that a promotion produced different results across markets. Every brand needs that information. It shows the outcome, but it says nothing about what consumers encountered when they walked in.
That silence matters because identical inputs can produce different results. Two stores can receive the same assortment, the same promotional campaign, and the same brand direction, and a few weeks later one is ahead of plan while the other falls behind. Sales data makes that difference easy to spot. Explaining it is the hard part, and it determines what the brand does next.
The same result can hide different stories
Picture several locations showing weak sales for the same product. The performance data suggests they share a problem. Inside the stores, the circumstances diverge. One has inventory available, but most of it in backstock. Another has the product on the floor, but in a spot nobody walking the aisle would notice. A third has the display set correctly, but associates can't answer questions about it. A fourth is executing well while a competitor doubled its presence nearby. The performance result looks the same. The conditions behind it are four different problems, each with a different fix.
The strong store deserves the same scrutiny. Its product may have better placement, a display executed as designed, and associates who bring it up with consumers. A competitor may have less presence there, or the store team may have found an additional merchandising opportunity nobody planned. Those conditions matter precisely because they can repeat elsewhere.
The risk is not just incomplete information. It is confident misinterpretation. If weak sales get read as weak demand when the real issue is availability or placement, the response addresses the wrong problem, and the real one keeps costing money. The stakes are measurable: McKinsey's research on retail operations finds that a 1 percentage-point improvement in in-stock rates can lift sales by 20 to 35 basis points. In-store conditions drive the numbers executives read outside.
Three layers tell a more complete story
A useful way to frame retail performance is as three connected layers.
Performance data answers what happened. Sales, inventory movement, sell-through performance, and promotional results show the outcome the business experienced.
Execution data answers what was happening in the store. Availability, placement, display condition, signage and promotional presence describe how the brand was represented at the point of sale while those results were forming.
Field context answers why those conditions might exist. Conversations with store teams, competitive activity, traffic, staffing pressure, and local circumstances explain what shapes the environment. A promotion executed perfectly during a week of unusually low traffic reads very differently from one that never made it out of the box.
Each layer is useful alone. Connected, a sales decline stops being a red number on a dashboard and becomes a signal teams can investigate with evidence. None of it means a single store observation proves why performance changed; retail has too many moving parts for that, and correlation deserves skepticism. It means the investigation starts with store facts instead of a list of guesses.
The execution gap distorts how results get read
A retail strategy can be well planned, clearly communicated, and deployed across hundreds of stores, and still reach consumers unevenly. Product arrives but stays in the back. A display goes up complete in one store and half-built in another. Signage disappears. Store teams juggling competing priorities get to the brand's initiative on different days, or not at all. The space between what was planned and what consumers experienced is the execution gap, and it bends every performance number that passes through it.
Consider a promotion running across several hundred locations for a skincare line. The combined result comes in below plan, and the campaign gets labeled a miss. The national average may hide the useful story: stores where the promotion was fully executed performed one way; stores where product was unavailable, or signage never went up, performed another; and certain markets struggled with execution all season. The question worth asking is not only whether the promotion performed. It is whether consumers had a consistent opportunity to experience the promotion at all.
That distinction decides what changes next. If an initiative performs where execution is strong and struggles where execution breaks down, the strategy probably isn't the first thing to fix; the opportunity is availability, merchandising support, or field attention in the locations that need it. If execution is consistently strong and performance still falls short, teams have real grounds to revisit the strategy itself. Either way, the brand is acting on evidence instead of relabeling a program as a success or failure. This is where field teams take on a second job as witnesses to the work itself: they can verify what happened in each store, document the conditions surrounding an initiative, and capture context that never appears in a sales report.
The prize is well documented. PwC's research on out-of-stocks puts typical rates at 5 to 10 percent and notes that addressing availability issues can push them below 1 percent, with a potential sales lift of 2 to 4 percent. Leadership is paying attention to the floor again: Deloitte's retail industry outlook research suggests more than one-third of retail executives see improving the in-store experience as a top growth opportunity. What happens inside stores is a business-performance question, not a line item in an operations report.
Visibility only counts when stores can be compared
Knowing what happened in one store is useful. Knowing whether the same thing is happening across 50, 500, or 5,000 stores is where visibility starts becoming intelligence, and plenty of visibility never gets there. A brand can collect photos, visit notes, and compliance checks from every location and still can't see a pattern because the information arrives in incompatible shapes. One rep describes a display as “good.” Another logs “mostly compliant.” A third uploads a photo with no note about what is right, what is wrong, or what was done. The brand can see each store but can't compare them.
Comparability comes from structure: the same questions answered the same way in every location. What was observed? What was the expected standard? Did the store meet it, and if not, what was different? What action did the rep take? What evidence supports the observation? What store conditions help explain it? Answered consistently, those questions create a common language for execution, and the right technology holds that language steady across thousands of visits so a placement issue in Tucson can be matched against one in Tampa. The individual observation still matters. Its value multiplies when it connects to every other observation the program produces.
Structure should not flatten what people notice
Consistency is not the same as turning every visit into a rigid checklist. Some of the most valuable field intelligence is what nobody anticipated when the visit was designed: a conversation with an associate that explains why product keeps landing in backstock, a competitor inching into adjacent space, a display that technically meets the standard but sits somewhere consumers never look. The best store insights rarely show up on a dashboard, and the relationships reps build with store teams are often what surface them, because strong store relationships create stronger retail intelligence than any audit form. Structured reporting establishes the baseline. Human observation explains what the baseline means.
The full progression is worth spelling out. Visibility shows what happened in a store. Structure makes that information usable beyond the visit. Comparison reveals similarities and differences across the footprint. Patterns show what may be happening across the broader retail network. Insight tells teams where to investigate, prioritize, or act. Each step depends on the one before it, the human layer is load-bearing throughout, and a program that stops at visibility has paid for intelligence and collected paperwork.
Patterns decide where to act
An individual observation solves an immediate problem. A rep finds product in the back, corrects a display, replaces missing signage. That action improves one store that day. The larger value arrives when the question changes from “what happened at store 142?” to “where else is this happening?”
Once brands capture execution information consistently, they stop reviewing visits one at a time and start reading the network. A field team that finds product in backstock once has a store-specific issue to fix. The same finding across dozens of doors within one retailer points to something structural: an inventory process, associate awareness, or a placement standard that doesn't survive contact with that retailer's store formats. The observation did not change. The scale of it did, and so does the response it deserves.
Patterns are also how brands separate what is wrong from what matters. A single missing sign in a low-volume door and a recurring availability problem across a group of high-volume stores can both appear as exceptions in a report, and they deserve nothing like the same response. Frequency, concentration, store opportunity, and whether previous fixes held are what turn a pile of exceptions into a ranked list. Patterns reveal where an issue is isolated and where it is systemic, where conditions are improving and where the same barrier keeps returning. They surface wins, too: locations that consistently execute well, or a recurring challenge field teams keep solving, become playbooks for everywhere else.
The working sequence is simple enough to run every week. Observe what is happening in stores. Structure it so it can be compared. Compare across stores, retailers, markets, and time. Connect what recurs with the performance signals the business already tracks, because a recurring availability issue means more when it clusters in stores that also show weaker sell-through performance. Then act: field support, training, a merchandising change, a retailer conversation, or deeper investment where an opportunity surfaced. Connecting execution and performance never means drawing a straight line from a display issue to a sales decline. It means the next investigation starts with evidence, not a theory.
One store signal can serve five teams
Field teams usually collect execution data, and program managers review it, but that is where its journey too often ends. The same information answers questions being asked across the organization, and leaving it in a field report wastes most of what it cost to collect. Take one composite signal: a new product is consistently available across a retailer's doors, placement is weak, and associates rarely mention it to consumers.
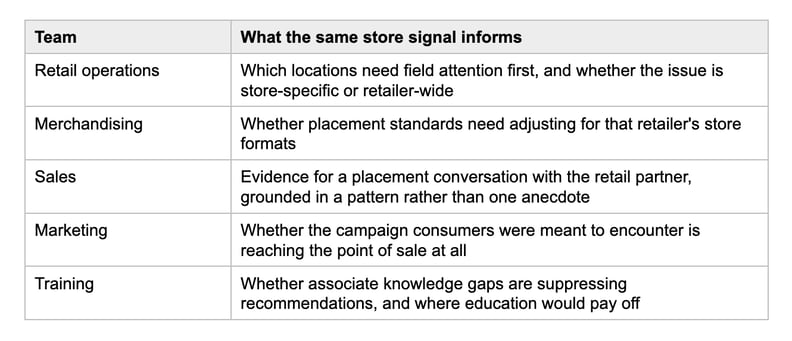
Every team reads the signal through its own lens, and all of them are working from the same store-level evidence rather than five separate anecdotes. Leadership gets the widest view: where execution challenges concentrate, where conditions are improving, which issues keep returning, and where investment is warranted. Set alongside sales and inventory signals, field activity becomes a legible business input rather than a cost center, which is the whole argument for pairing data-driven merchandising with execution in the first place. A store observation shared across teams stops being a record of one visit and becomes business intelligence. The field team captures it. The entire organization learns from it.
The next measure of retail execution is what it explains
For years, retail execution has been measured by what happened in the field: visits completed, displays corrected, product moved to the floor, associates trained. Those measures still matter, and they capture only part of the value a field program creates. The next measure is what all that activity helps the organization understand.
Go back to the espresso machine. With execution data in the picture, the markdown slide reads differently: availability broke down across a third of the doors, placement slipped in a specific store format, and sales held wherever the product was on the floor and visible. The recommendation changes from cutting price to fixing presence, and the brand keeps its margin. That is the difference between knowing more about stores and using what stores reveal to understand the business.
ThirdChannel was built for exactly that connection. Brand-matched field teams correct conditions in the store and capture structured, comparable evidence while they work, and real-time technology turns those observations into store-level intelligence teams across the organization can act on. If your performance data keeps raising questions your reporting cannot answer, request a Managed Retail Assessment and see what the stores have been trying to tell you.